
PREPARED BY: Communications Department
DATE: 2025-11-20
SUBJECT: Communications Report October 2025
BACKGROUND/PURPOSE:
Provide regular marketing and communication updates to the Board of Health.
| SOURCE | September 15 – October 14 | August 15 – September 14 | Difference |
|---|---|---|---|
| News Releases, Media Advisories and Statements, or Notices Issued | 2 | 6 | -4 |
| Media Requests Received | 9 | 10 | -1 |
| Wechu.org pageviews | 92,262 | 87,912 | 4,350 |
| YouTube Channel Subscribers | 1,858 | 1,852 | 6 |
| Email Subscribers | 6,639 | 6,649 | -10 |
| Emails Distributed | 7 | 10 | -3 |
| Facebook Fans | 20,042 | 20,034 | 8 |
| Facebook Posts | 66 | 71 | -5 |
| Twitter Followers | 8,303 | 8,312 | -9 |
| Twitter Posts | 65 | 70 | -5 |
| Instagram Followers | 2,135 | 2,119 | 16 |
| Instagram Posts | 24 | 38 | -14 |
| LinkedIn Followers | 2,014 | 1,979 | 35 |
| LinkedIn Posts | 24 | 17 | 7 |
| Media Exposure | 107 | 231 | -124 |
Data Notes can be provided upon request.
Media Exposure Overview Graph
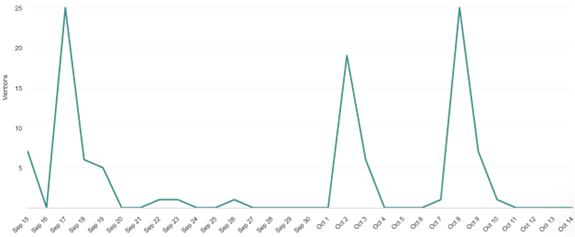
Notes: From September 15 – October 14, we experienced three main peaks in media exposure related to the weekly provincial measles summary article. Smaller points of activity were related to the launch of our new food safety dashboard (Sept. 19), as well as stories on the increase of sexually transmitted infections following a report at the Board of Health meeting (Sept. 22).
Website Overview Graph
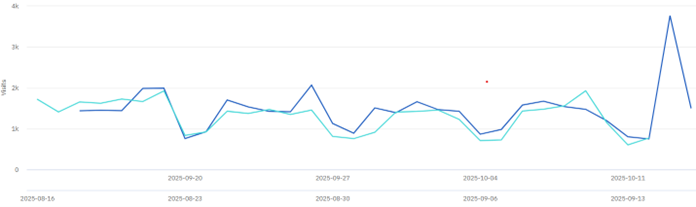
Notes: Darker blue line is current timeframe. From September 15 – October 14, we saw very steady web traffic at a slightly higher level compared to the previous month. This can be attributed to the launch of the food safety dashboard and the resulting traffic it experienced week over week.
Social Media Overview Graph (followers)
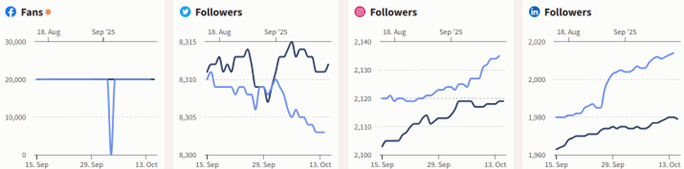
Notes: Lighter blue line is current timeframe. From September 15 – October 14, we saw a small increase in followers on Meta and LinkedIn, with a small decrease on X. Specifically, fans on Facebook have held very steady for the past two months. Note that the analytics tool experienced a glitch one day in the month, where it logged 0 fans.
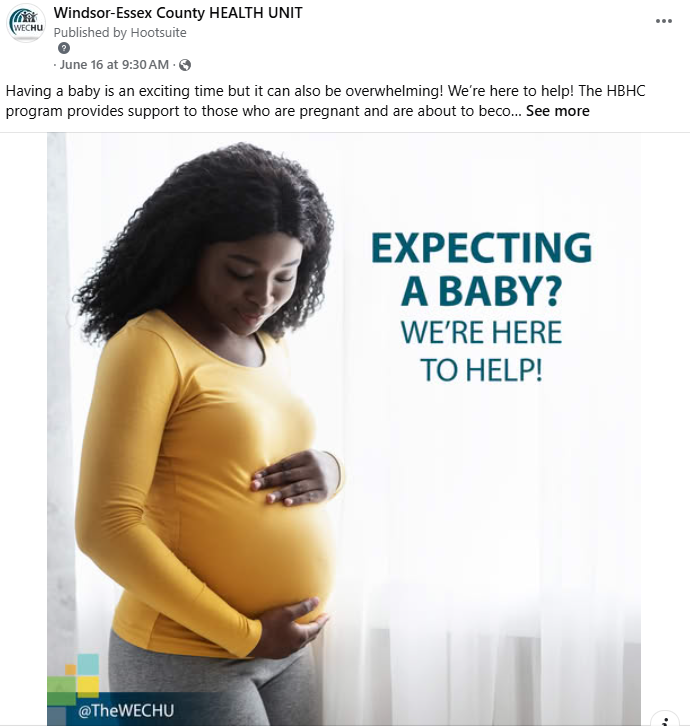
Discussion – Reels Performance
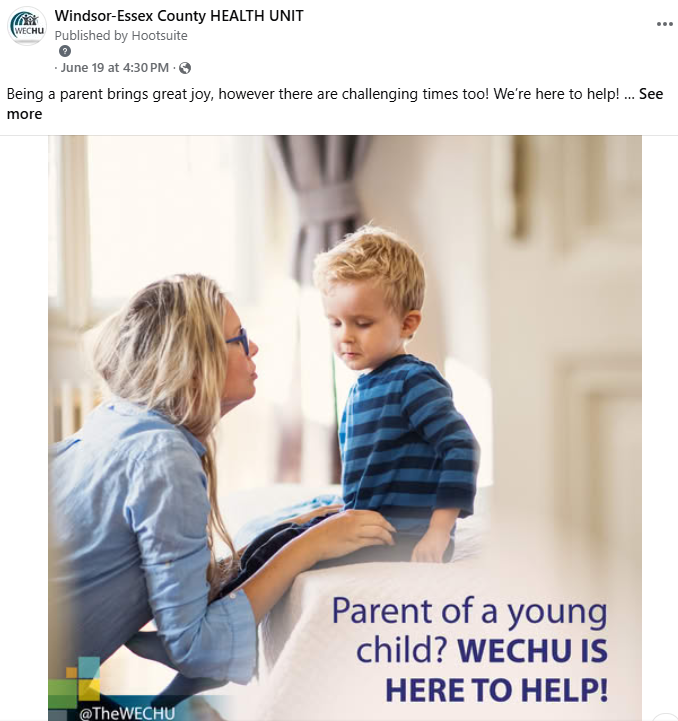
Throughout 2025, the Communications Department worked with the Healthy Families Department to promote their pregnancy and parenting services through two campaigns, one in the spring (June) and one in the fall (September).
The same creative aspects, timeframes, and budgets were used for both campaigns, allowing us to directly compare the two runs. While the ads in June received more impressions and reached more accounts, the ads in September resulted in more “actions”. Both ads in September received more engagement through reactions and shares. Additionally, they received more link clicks (48 and 95, respectively), which supported the goal of driving viewers to the website for more information.
It is noted that both campaigns did well overall. The fall campaign may have done better for a variety of reasons such as higher rates of pregnant persons looking for support, or more attention to social media platforms in the fall versus the spring (e.g., getting back into normal routines following summer).
| Creative Asset | June | September |
|---|---|---|
 |
Link Clicks – 154 CPC – $0.33 CTR – 3.47%
Impressions – 13,822 Reach – 8,123
Reactions – 5 Comments – 0 Shares – 0 |
Link Clicks – 202 CPC – $0.25
Impressions – 6,132 Reach – 3,167
Reactions – 85 Shares – 7 Comments – 0 |
 |
Link Clicks – 124 CPC – $0.40 CTR – 1.74%
Impressions – 20,091 Reach – 10,774
Reactions – 11 Comments – 2 Shares – 2 |
Link Clicks – 219 CPC – $0.23
Impressions – 4,660 Reach – 2,523
Reactions – 126 Shares – 7 Comments – 5 |