
PREPARED BY: Communications
DATE: 2026-02-05
SUBJECT: Communications Report January 2026
BACKGROUND/PURPOSE:
Provide regular marketing and communication updates to the Board of Health.
| SOURCE | December 15 – January 14 | November 15 – December 14 | Difference |
|---|---|---|---|
| News Releases, Media Advisories and Statements, or Notices Issued | 2 | 3 | -1 |
| Media Requests Received | 20 | 10 | 10 |
| Wechu.org pageviews | 77,756 | 74,623 | 3,133 |
| YouTube Channel Subscribers | 1,868 | 1,866 | 2 |
| Email Subscribers | 6,615 | 6,630 | -15 |
| Emails Distributed | 4 | 5 | -1 |
| Facebook Fans | 26,217 | 26,146 | 71 |
| Facebook Posts | 60 | 66 | -6 |
| Twitter Followers | 8,290 | 8,289 | 1 |
| Twitter Posts | 55 | 48 | 7 |
| Instagram Followers | 2,191 | 2,178 | 13 |
| Instagram Posts | 35 | 40 | -5 |
| LinkedIn Followers | 2,055 | 2,048 | 7 |
| LinkedIn Posts | 21 | 16 | 5 |
| Media Exposure | 110 | 55 | 55 |
Media Exposure Overview Graph
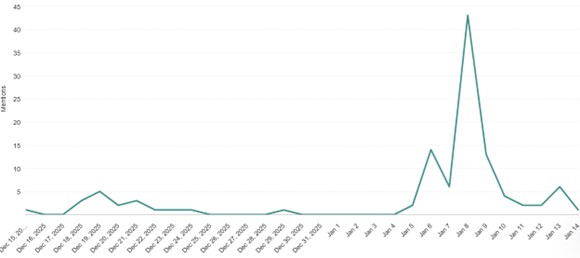
Notes: From December 15 – January 14, we experienced two main peaks in media exposure, and two smaller peaks. The two main peaks resulted from news releases issued by the health unit. On January 6, coverage was on the surge in flu cases locally, and on January 8 coverage was for the warning on the risks of cannabis edibles. Two smaller peaks included an early warning about flu cases (December 19), and the health unit’s concern on the City of Windsor’s proposed budget cuts to transportation.
Website Overview Graph
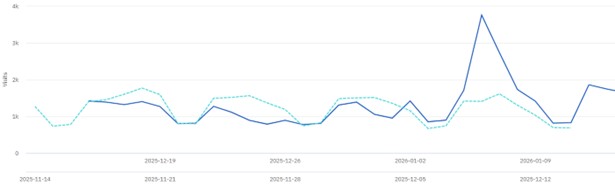
Notes: Darker blue line is current timeframe. From December 15 – January 14, we saw very steady web traffic at a slightly lower level compared to the previous month, likely due to the holiday season. However, we had a large spike in traffic which can be tied to the news release regarding the surge in flu cases (January 6).
Social Media Overview Graph (followers)
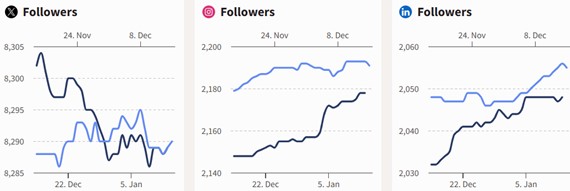
Notes: Lighter blue lines are the current timeframe. From December 15 – January 14, we saw a moderate increase in followers on Meta platforms, and steady audiences on X and LinkedIn.
Discussion – Anti-Stigma Campaign
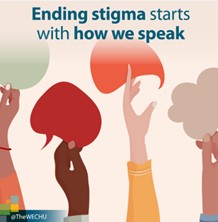
Starting in October of 2025, the Communications Department supported the Substance Use Prevention and Harm Reduction Department with a series of seven boosted posts on social media. The posts promoted a reduction in stigma around substance use, supporting those who seek help, and pointing clients to local services and programs.
On a weekly basis, these posts were among the top performing posts on Facebook. Each post was boosted for five days. Between the seven posts, they averaged 277 link clicks, 156 reactions, 14 comments, and 19 shares. The top performing post of the group had 341 link clicks and 235 reactions.