


PREPARED BY: Communications
DATE: 2026-11-12
SUBJECT: Communications Report September 2026
BACKGROUND/PURPOSE:
Provide regular marketing and communication updates to the Board of Health.
| SOURCE | August 15 – September 14 | July 15 – August 14 | Difference |
|---|---|---|---|
| News Releases, Media Advisories and Statements, or Notices Issued | 4 | 12 | 8 |
| Media Requests Received | 7 | 20 | -13 |
| Wechu.org pageviews | 91,038 | 130,955 | -39,917 |
| YouTube Channel Subscribers | 1,871 | 1,868 | 3 |
| Email Subscribers | 6,482 | 6,498 | -16 |
| Emails Distributed | 8 | 17 | 9 |
| Facebook Fans | 27,193 | 27,178 | 15 |
| Facebook Posts | 68 | 85 | -17 |
| Twitter Followers | 8,230 | 8,235 | -5 |
| Twitter Posts | 59 | 76 | -17 |
| Instagram Followers | 2,399 | 2,369 | 30 |
| Instagram Posts | 61 | 60 | 1 |
| LinkedIn Followers | 2,217 | 2,192 | 25 |
| LinkedIn Posts | 23 | 48 | -25 |
| Media Exposure | 79 | 309 | -230 |
Media Exposure Overview Graph
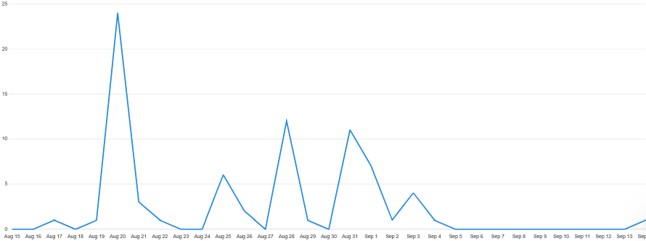
Notes: From August 15 – September 14, we experienced one main peak in media exposure related to a provincial story on the tiger mosquito. Two smaller peaks occurred due to beach water testing results as well as a heat warning which was issued for the region.
Website Overview Graph
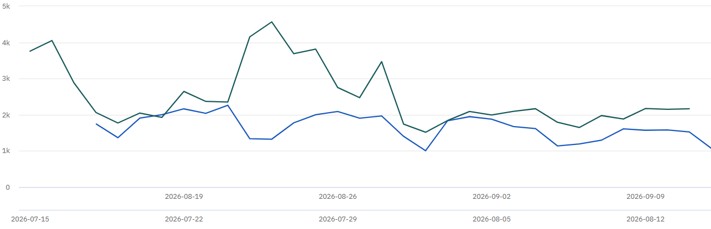
Notes: Blue line is current timeframe. From August 15 – September 14, we saw very steady web traffic at a lower level compared to the previous month, likely due to the decrease in news releases issued to draw people to our site.
Social Media Overview Graph (followers)
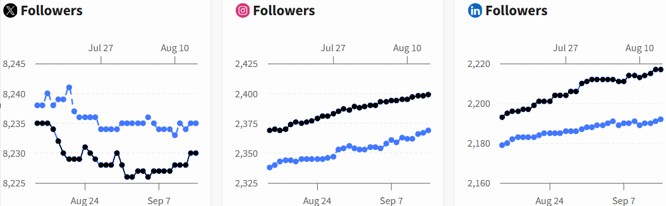
Notes: Dark lines are the current timeframe. From August 15 – September 14, we saw a moderate increase in followers on Meta platforms and LinkedIn, with a decline in followers on X.
Discussion – Beach Water Testing Season
The 2026 beach water testing season officially started on Friday, May 29 with a news release announcing the first set of lab-based results. This year, both the daily predictive modeling results were shared along with the weekly lab testing for 14 weeks, with the final results issued on Friday, August 28.
Both sets of results are added to the main beach water testing homepage on wechu.org, which is where the public-facing communication pieces point. Over the course of the season, it received 30,522 visits from 15,335 unique visitors. This traffic can be related to the links from the communication pieces distributed (i.e., social media posts and emails), as well as general traffic which visited the page to see predictive modeling results.
Over the 14 weeks of the season, communication pieces included 28 emails (two per week to address both general subscribers and the media), and 19 social media posts (14 with the weekly results, and 4 additional informational posts on beach water safety, and 1 reel). When looking specifically at the beach water result posts (which are regularly some of the most popular posts each week), they garnered a total of 11,326 clicks, and 314 shares. The reel, which was newly created this year and explained the beach water testing process, yielded 725 views.