September 2025 Board of Health Meeting - June 15 - July 14, 2025 Communications Update Information Report
PREPARED BY: Communications Department
DATE: 2025-09-18
SUBJECT: Communications Report July 2025
BACKGROUND/PURPOSE:
Provide regular marketing and communication updates to the Board of Health.
| SOURCE | June 15 - July 14 | May 15 - June 14 | DIFFERENCE |
|---|---|---|---|
| News Releases, Media Advisories and Statements, or Notices Issued | 11 | 9 | 2 |
| Media Requests Received | 6 | 17 | -11 |
| Wechu.org pageviews | 90,737 | 89,667 | 1,070 |
| YouTube Channel Subscribers | 1,839 | 1,838 | 1 |
| Email Subscribers | 6,707 | 6,723 | -16 |
| Emails Distributed | 14 | 13 | 1 |
| Facebook Fans | 19,871 | 19,851 | 20 |
| Facebook Posts | 70 | 73 | -3 |
| Twitter Followers | 8,306 | 8,316 | -10 |
| Twitter Posts | 66 | 65 | 1 |
| Instagram Followers | 2,087 | 2,072 | 15 |
| Instagram Posts | 36 | 25 | 11 |
| LinkedIn Followers | 1,950 | 1,930 | 20 |
| LinkedIn Posts | 14 | 21 | -7 |
| Media Exposure | 197 | 201 | -4 |
Data Notes can be provided upon request.
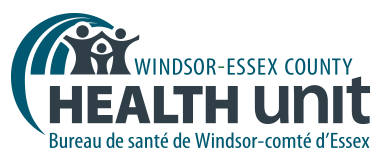
Media Exposure Overview Graph
Notes: From June 15 – July 14, we experienced four main peaks in media exposure.
On June 18, 25, and July 2 – the spikes in our media coverage was due to a weekly provincial news story which provided an update on measles, mentioning all public health units with cases. The spike on July 11 is related to stories on a heat alert along with the weekly beach water testing results.
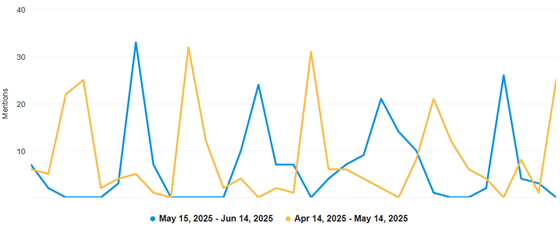
Website Overview Graph
Notes: Darker blue line is current timeframe. From June 15 – July 14, we saw very steady web traffic at a comparable level to last month.
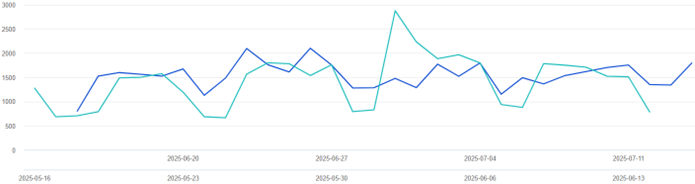
Social Media Overview Graph
Notes: Lighter blue line is current timeframe. From June 15 – July 14, we saw an increase in followers across all platforms with the exception of Twitter, where we continue to see a gradual decrease in followers. This may be explained by the number of people who are opting to leave the platform in protest of Elon Musk’s management.
Discussion – Phase 3 of Corporate Campaign
At the end of 2024, the Communications Department rolled out the WECHU’s Corporate Campaign (Supporting Better Health for All) through a variety of media outlets. The four professional-created videos and corresponding audio files rolled out on Google, Meta, and two local radio stations.
As a change from the Phase 2 campaign, the videos were issued in opposite order to determine if the order made a difference in view interest.
The assets performed well on both Google and Meta with the following metrics:
| Google Ads | Meta Ads | ||||
|---|---|---|---|---|---|
| Video | Impressions | Views | Impressions | Views | Clicks |
| Video 4 – Ensuring your wellbeing | 334,278 | 7,550 | 219,744 | 31,757 | 1,653 |
| Video 3 – Community services | 135,873 | 9,375 | 241,892 | 32,031 | 1,391 |
| Video 2 – Best known services | 194,644 | 8,675 | 188,088 | 25,861 | 1,343 |
| Video 1 – Outdoors | 229,837 | 8,589 | 142,911 | 22,304 | 1,409 |